
Use Case
New Data Intelligence
Case Study
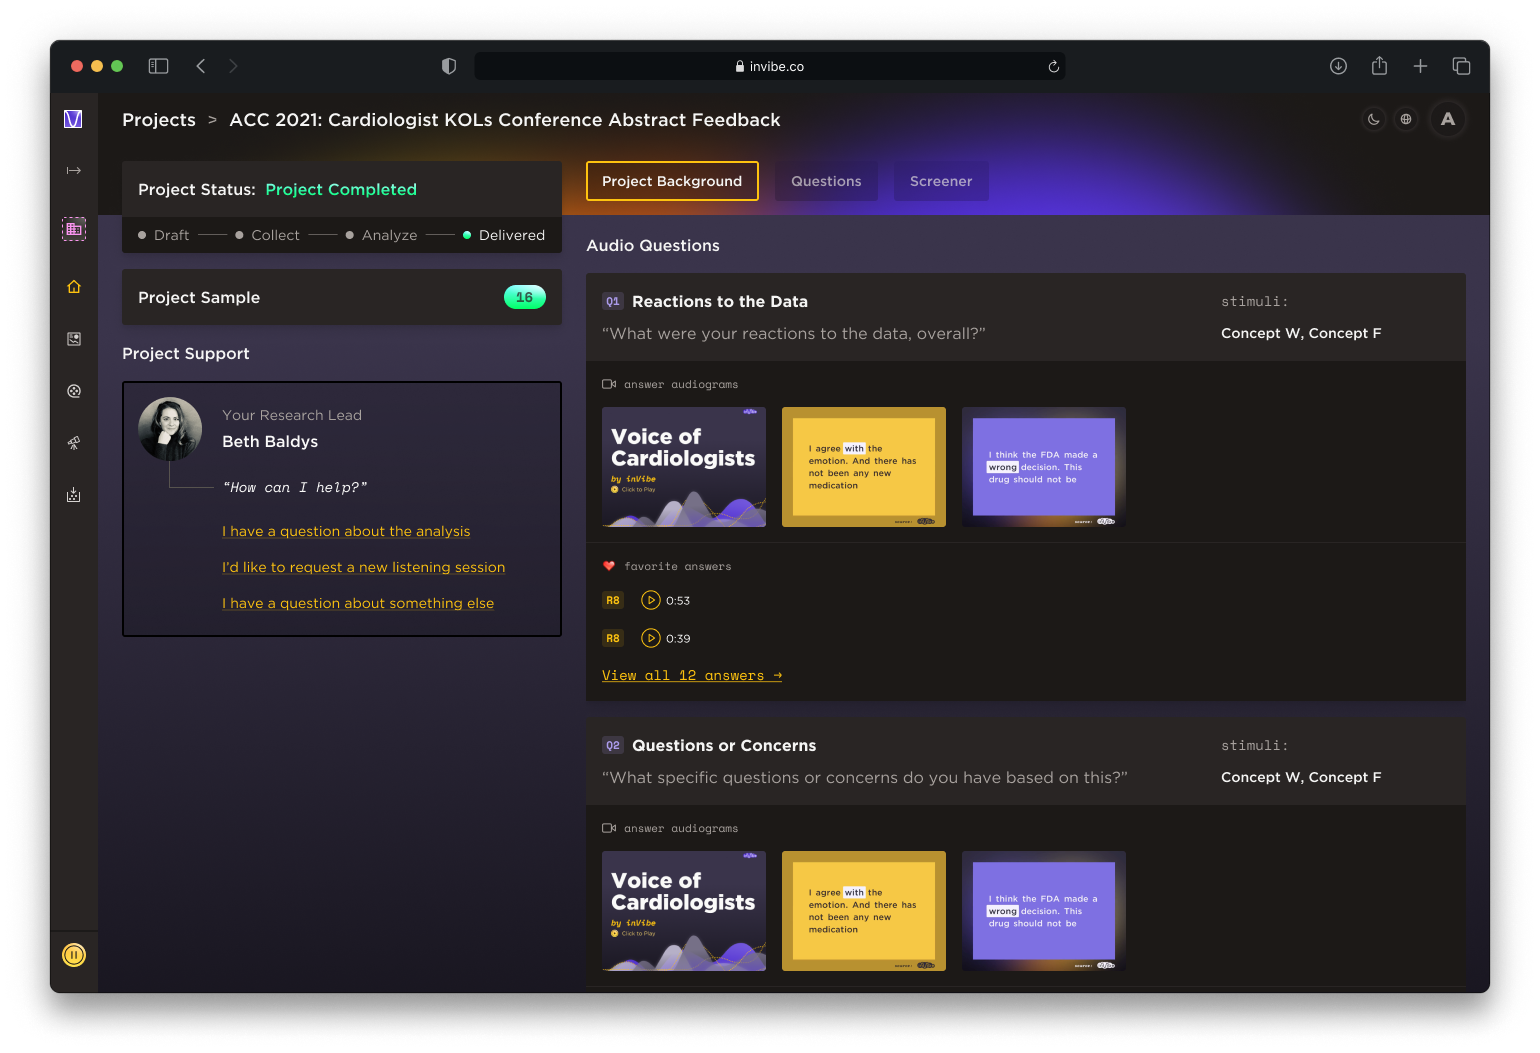
Unlocking HCP Market Intelligence at In-Person & Virtual Conferences
Client Goal
A Pharmaceutical company wanted to know what their key stakeholders thought and felt about new clinical data being presented at an important industry conference regarding their product.
Objective 1
Evaluate physician attitude & confidence regarding data presented at the conference.
Objective 2
Measure physician enthusiasm, or lack thereof, regarding the data that was presented.
Objective 3
Determine impact data may have on HCPs’ Rx behavior if product approved.
The inVibe Solution
inVibe’s New Data Intelligence solution allowed our pharmaceutical client to quickly and efficiently deploy a voice-powered research study to gauge physician reactions to the data presented at a conference.
1. Collect
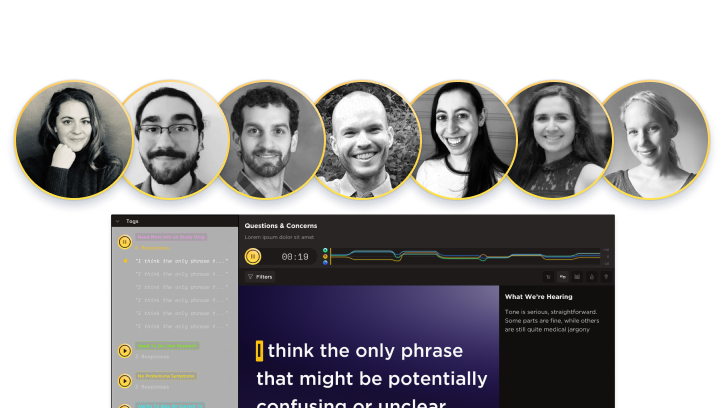
Within 3 days, inVibe recruited 20 cardiologists on client target list who had attended conference, in-person or virtually. The physicians reviewed data abstracts on their computers and smartphones, participated in an automated phone interview, and responded to questions about the data simply by speaking.
Key Questions
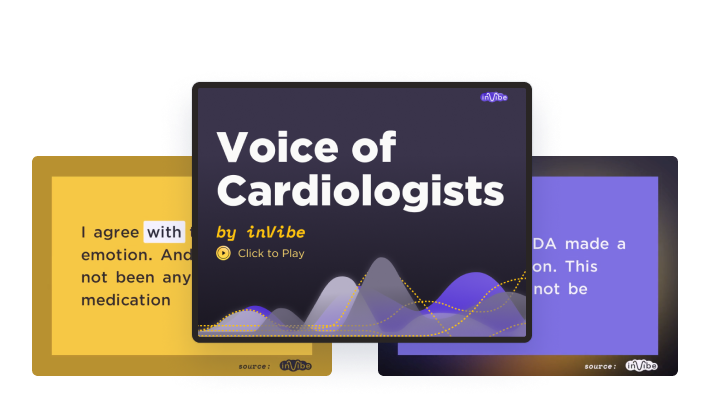
Q1
What were your reactions to the data, overall?
Q2
What specific questions or concerns do you have based on this?
Q3
What was the most compelling takeaway from the data sets being released?
Q4
Based on data/information shared at the conference, how do expect to treat your patients in the future?
2. Analyze
inVibe’s analysts leveraged their language expertise and advanced NLP tools to process, evaluate and analyze multiple aspects of each physician’s response, including content, language, and emotion derived from speech-emotion recognition, allowing for deeper insights, faster.
What is Said
Summarize and categorize the content and themes.
How it’s Said
Identify the language patterns and construction.
How it Sounds
Utilize machine learning and acoustic technology to assess the emotionality.
3. Deliver
The client was provided with an interactive report via an online dashboard, along with the voice data, transcripts, and a high-level analysis. An in-house analyst walked the client through all of the most meaningful data, supporting each insight with specific voice data.
Audiogram
Videos
Clients have access to drag & drop tools to instantaneously create kinetic text animations from transcripts for internal sharing.
Listening
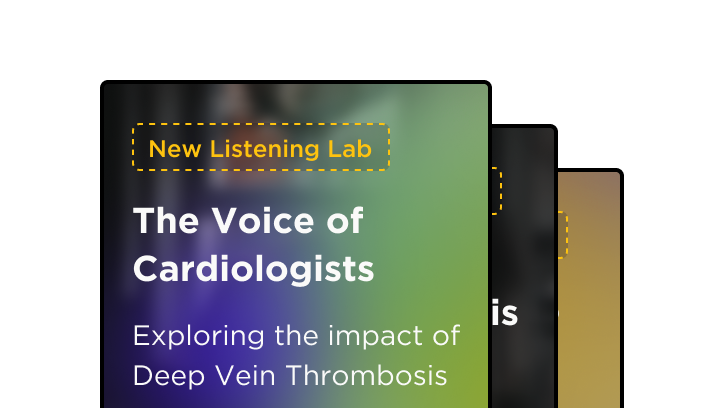
Labs
inVibe delivers self-guided interactive stories assembled from transcripts, audio, and charts – annotated with high-level expert observations.
Expert
Perspective
inVibe’s team of in-house analysts and language experts walk clients through the insights and recommendations derived from the research.
Key Insights & Recommendations
Based on the insights, inVibe recommended that the team take the following actions during a brand launch, if product received FDA approval:
#1
Focus outreach on slow/late adopter physicians leveraging disease state educational campaigns to help overcome the low level of enthusiam measured with this target segment.
#2
Present physicians with competitor data alongside their own data to create clear separation between treatment options, as language analysis showed stronger positive attitude among those familiar with competitor data.
#3
Develop case studies that highlight long-term safety data with with low-risk patients, as this data generated the highest level of confidence with all physician segments.
Ready to learn more?
/voice
/resources
/use-cases
- New Data Intelligence
- TrialPulse — Evaluation of Clinical Trial Recruitment Assets
- Concept / Message Testing
- Customer Journey Inflection Points
- Agency Pitch for New Business
- TrialPulse — DCT Design and Informed Consent
- Language of Disease
- Customer Stories
- Decision Drivers
- Market Trends
- TrialPulse — Disease Burden and Endpoint Selection
- HCP – Patient Communication
2025 inVibe - All Rights Reserved